


Third-party Observability
SnapLogic Third-party Observability works with monitoring tools that support OpenTelemetry (OTel).
SnapLogic Monitor provides visibility into pipeline execution and infrastructure health. The Third-party observability feature enables you to integrate Groundplex node execution logs and metrics with third-party observability tools.
Observability tools:
-
Consolidate the monitoring of many applications in one interface to reduce the total cost of ownership (TCO).
- Simplify issue mitigation with early detection.
- Retain historical data for audits.
Third-party Observability is available by subscription and works with tools that support the OpenTelemetry (OTel) format. SnapLogic currently certifies support for Datadog and New Relic. Contact your CSM for more information.
Integration architecture
In environments subscribed to Third-party Observability, Groundplex JCC services use the OpenTelemetry API and SDK to instrument logs and metrics in OpenTelemetry Protocol (OTLP) format. To use the service, you configure and deploy an OpenTelemetry Collector for each node. The Collector receives logs and metrics from the application and routes them to a third-party tool.
Two instrumentation paths feed data to the Collector:
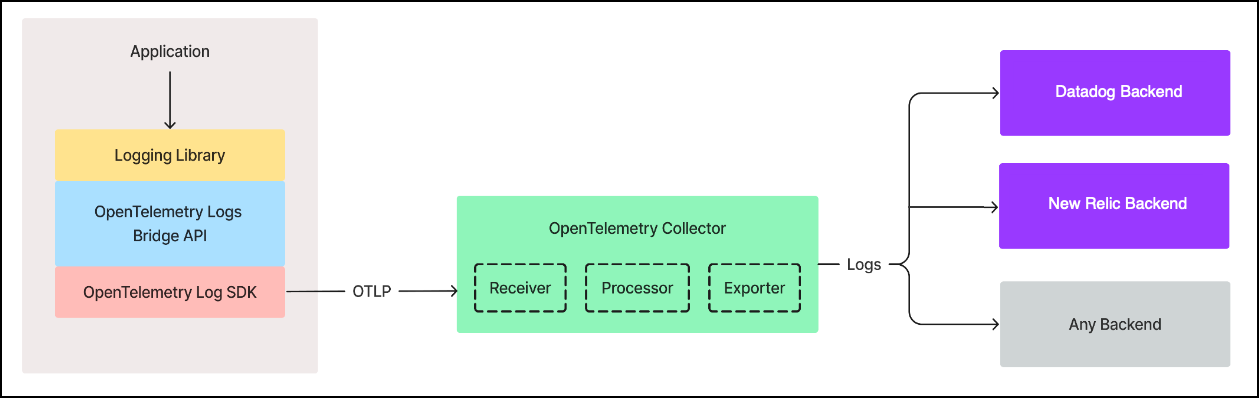
- Logs: Uses the OpenTelemetry Logs Bridge API and Logs SDK to forward application logs in OTLP format.
- Metrics: Uses the OpenTelemetry Metrics SDK to export runtime metrics in OTLP format.
Three components comprise the OpenTelemetry Collector:
- Receiver: Accepts incoming logs and metrics from the application.
- Processor: Transforms or filters the data before export.
- Exporter: Sends the processed logs and metrics to the configured backend.
The following diagram illustrates how the SnapLogic Platform implements the OpenTelemetry service.
When a user manually downloads logs from a node, multiple types of logs are included. However, only a subset of these logs, that is, the structured logs from runtime-log.json are available via the OpenTelemetry logs pipeline. These are the logs emitted by the Snaplex runtime and collected through the configured OTel receivers. The metrics pipeline separately exports runtime metrics such as resource utilization from the node.
OTel workflow
To set up Groundplex monitoring for an OTel-compatible third-party tool:
- Configure an OpenTelemetry collector.
- Configure Groundplex nodes.
- Deploy the OTel collector and restart the Groundplex nodes.
- Run some pipelines to verify the configuration.
The specific procedures depend on how the Groundplex is deployed and the observability tool you want to use. SnapLogic certifies that the Third-party Observability feature works with Datadog and New Relic.
The documentation provides specific instructions for:
- Datadog with a Groundplex deployed on Kubernetes, where the OpenTelemetry collector runs as a DaemonSet.
- New Relic with a Groundplex deployed on Docker.
- Datadog with a Groundplex deployed on Windows.
- Datadog with a Groundplex deployed on Linux.
- Observe in Datadog.
- Observe in New Relic.
- Node metric reference.