


Alert history
The Alert history page displays the alerts generated by Snaplex nodes for the specified time range. View alerts and the accompanying logs to identify and address Snaplex issues such as congestion. A variety of Snaplex-related events also show up in the Activity log.
Tip: Check out the Notification Center Alerts tab,
which contains the same alerts as the Alert history page.
The following image shows an example of the Alert history page:
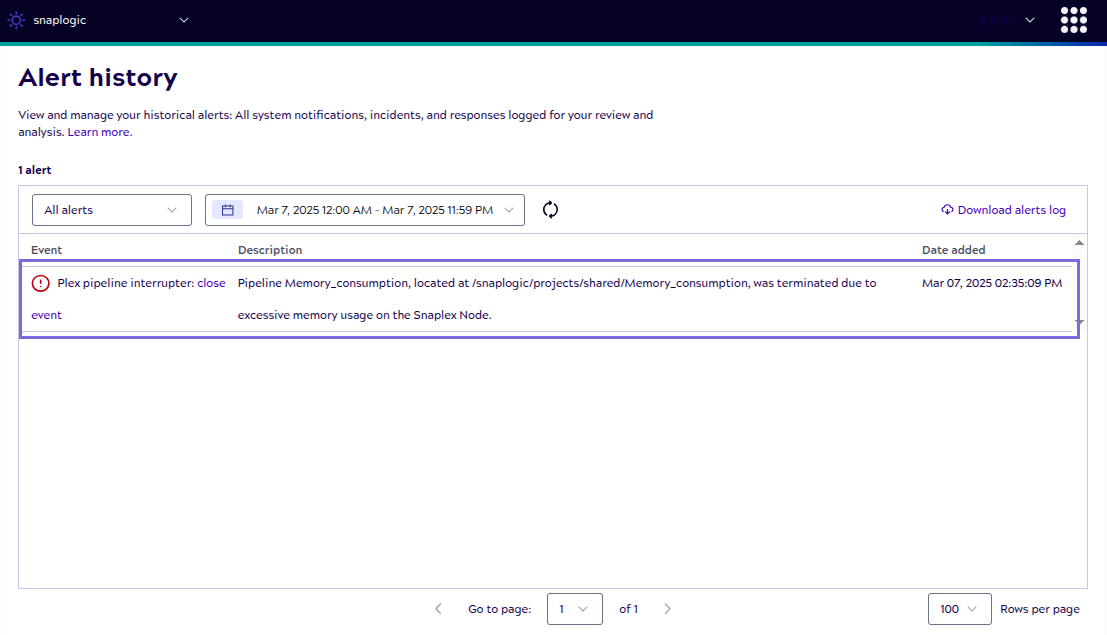
Use controls on this page to:
- Filter alerts by status: All, Open, or Closed. Alerts are open until you close them.
- Select the report date range.
- Download alerts log: Download formatted alert data in CSV file format suitable for viewing and reporting.
- Download raw data: Download raw data with unformatted API fields in CSV file format for custom processing or integration with external systems.
- Close alerts that you've addressed by clicking the three-dot menu at the end of the row and then clicking the Close button.
Snaplex nodes raise alerts for problems during initialization. You can address these alerts for self-managed Snaplexes (Groundplexes). SnapLogic manages issues with Cloudplexes.
The Alert history table also displays the alerts generated due to excess memory usage on the Snaplex node.
Table configuration and filters
Click  to open the Table
configuration and filters dialog.
to open the Table
configuration and filters dialog.
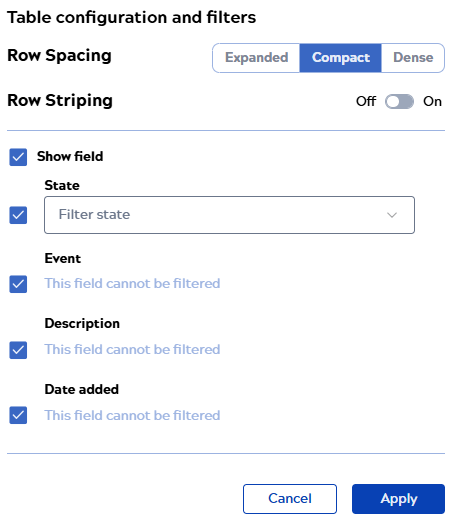
From the Table configuration and filters dialog, you can:
- Select any of the following row spacing options:
- Compact to show more table rows with the decreased row height.
- Expanded to show fewer table rows with the increased row height.
- Dense to display the same number of table rows as shown in the Compact view but with reduced icon size and padding.
- Enable row striping.
- Show or hide columns by checking or unchecking the box next to the name.
- Reorder columns by hovering near the name and dragging the handle that displays to the right.
- Filter columns by selecting a value from the dropdown list.
Click Apply to save the changes.