Agent Visualizer Diagram and Log Layout
Understanding the Agent Visualization
Agent hierarchy diagram
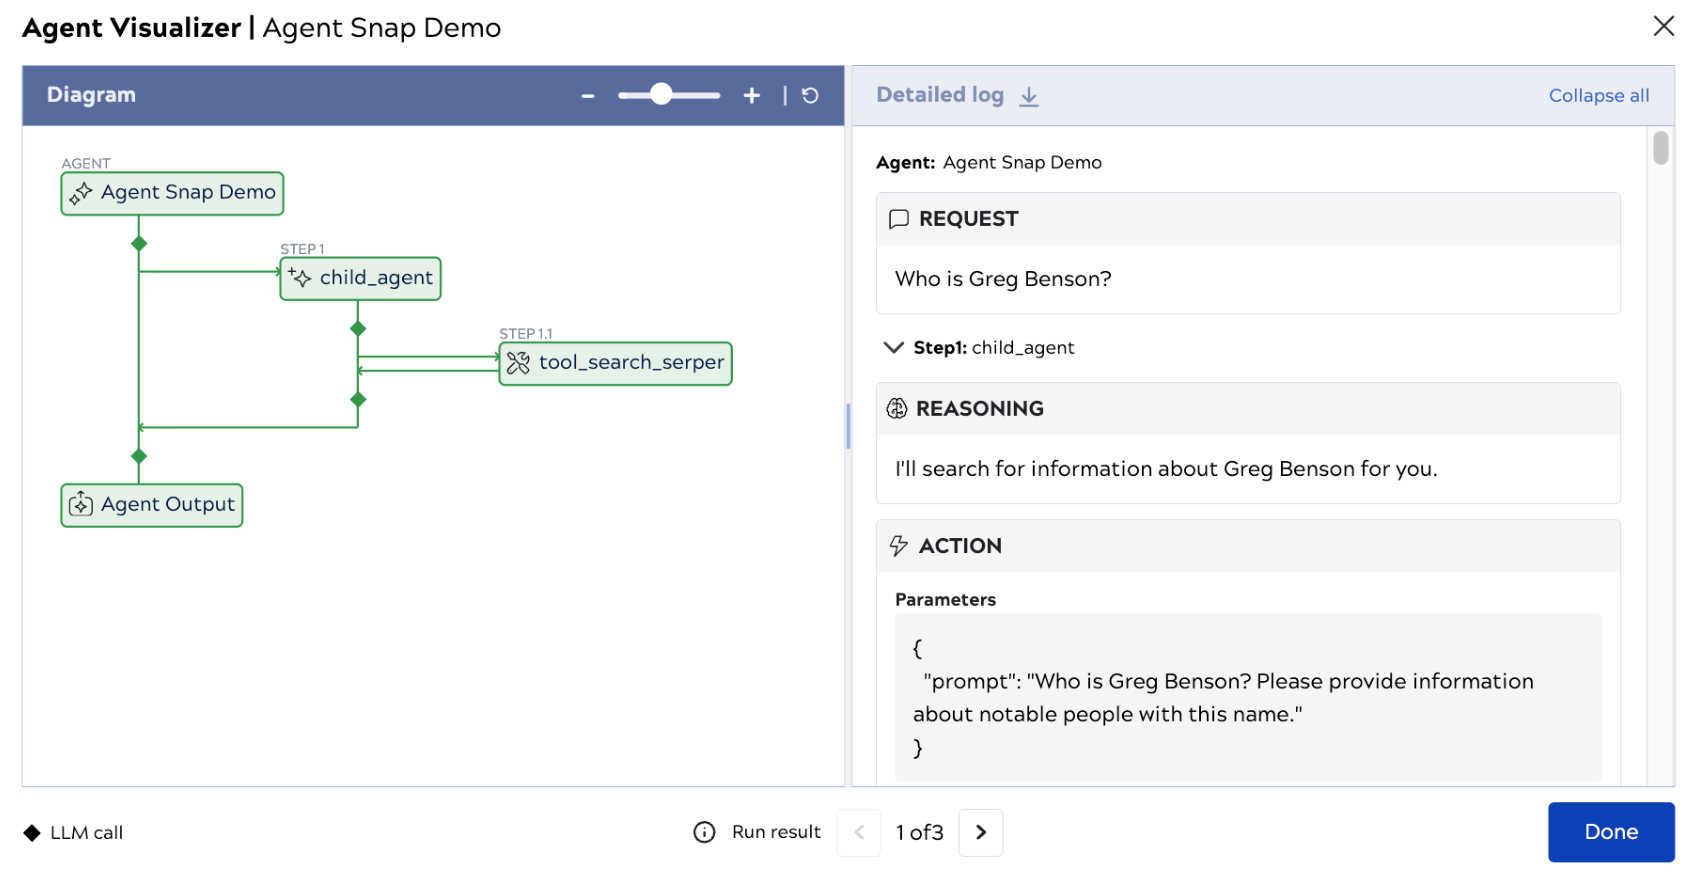
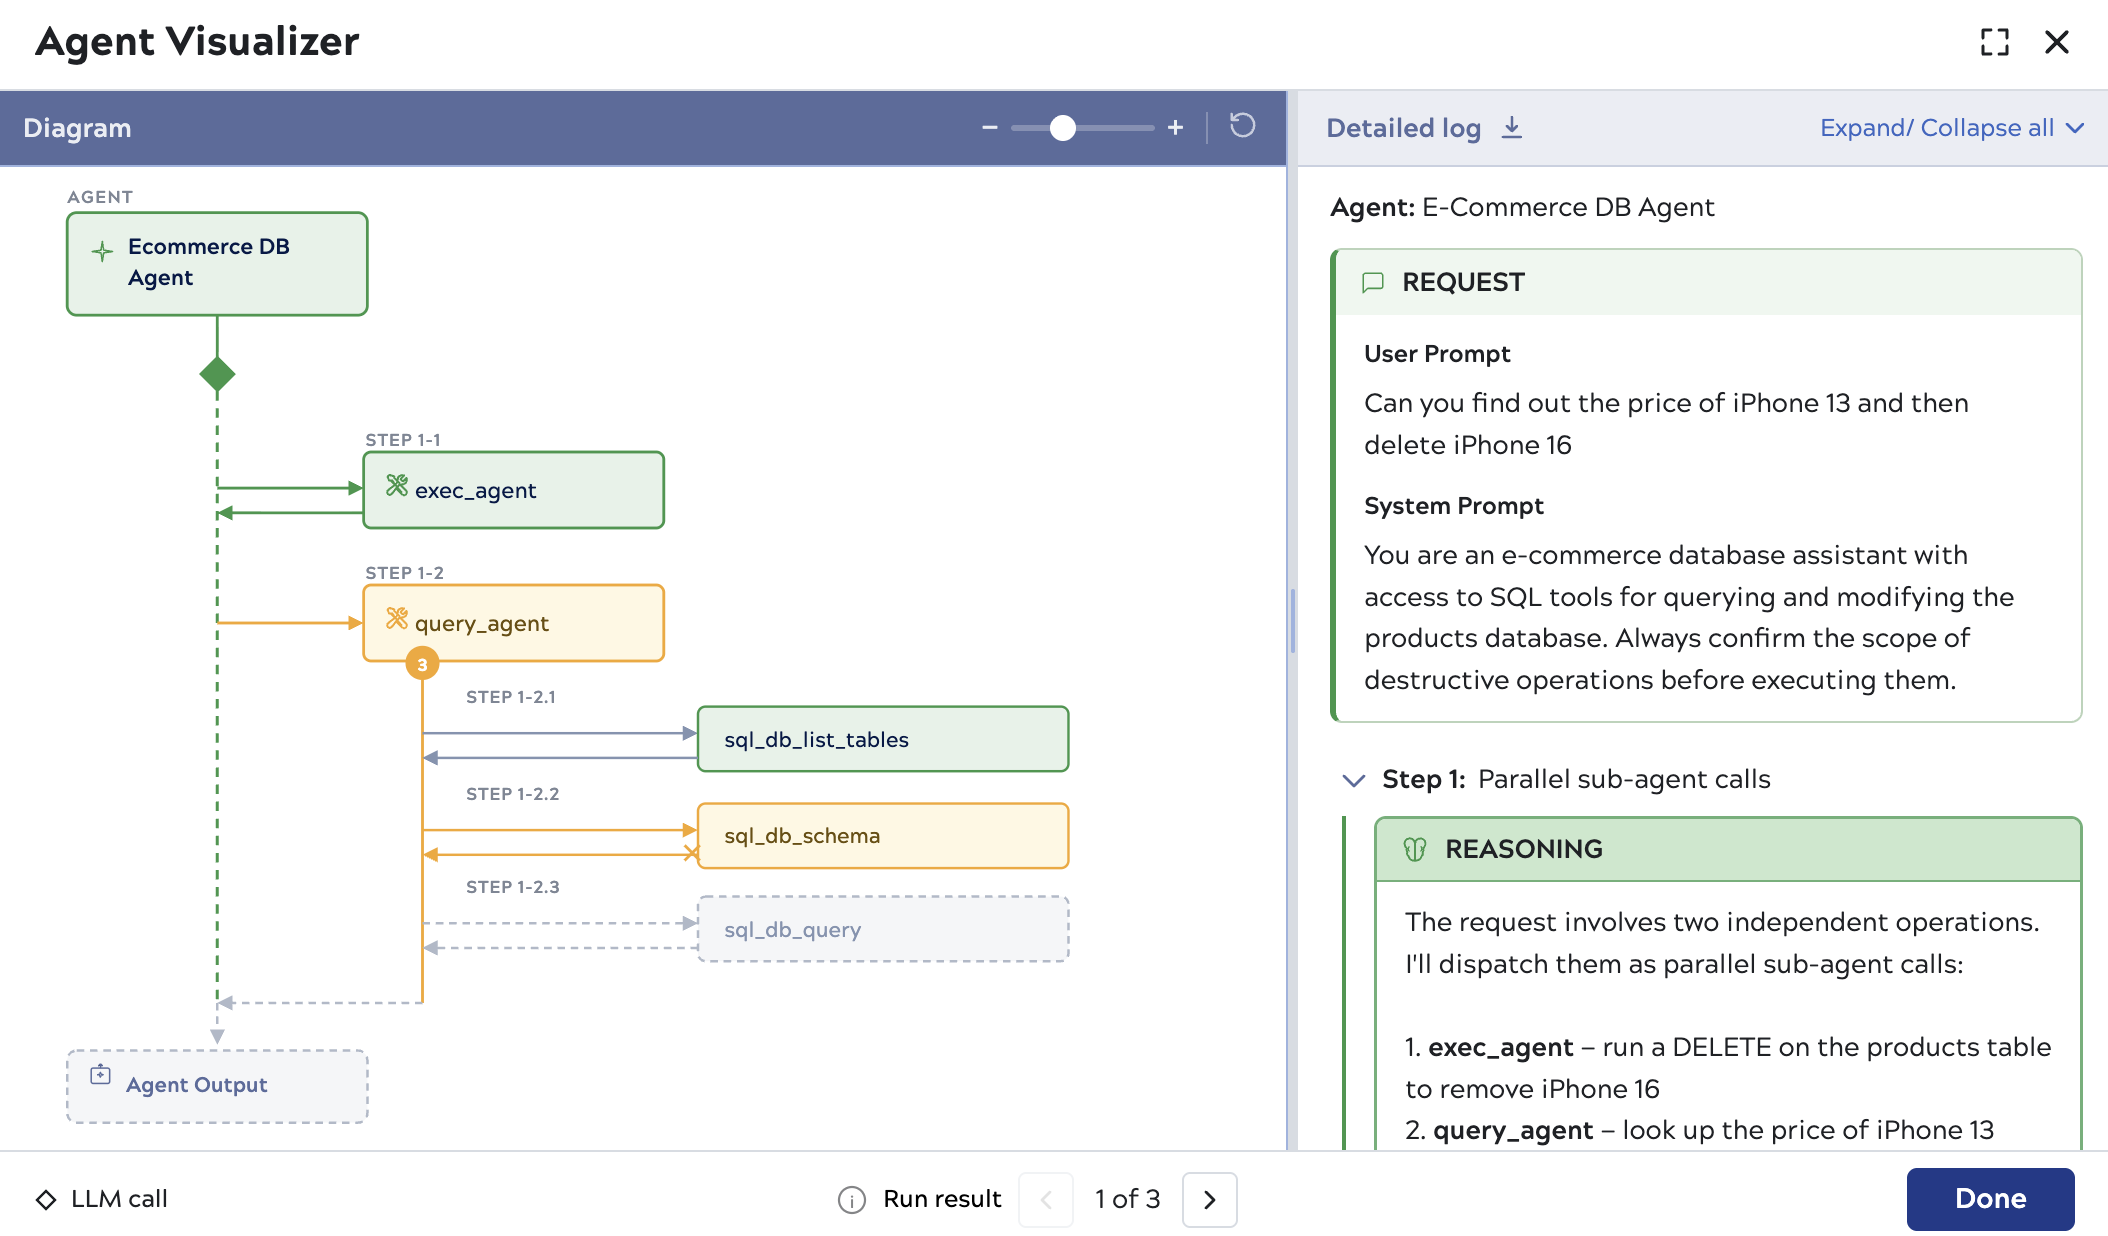
On the left side, the Agent Visualization Diagram shows the relationship between your Agent and tool pipelines.
When a pipeline validates successfully, the visualization is green. When an error occurs, the visualization turns red. Arrows indicate the requests and responses made throughout the agent flow.
The following table describes the icons used in the visualization.
| Label | Description |
|---|---|
|
|
Main agent |

|
Sub agent |
|
|
Tool |
|
|
Agent output |
|
|
LLM call |
|
|
LLM response |
Agent log
On the right side, the Detailed Log records the interaction between the prompt and Agent pipeline processing into the Request and Actions panes.
- REQUEST: Displays the user prompt and, when configured, the system prompt.
- REASONING: Shows the logical process of the agent for the following action.
- ACTION: Tracks the information for each invoked tool.
- PARAMETERS: Displays the corresponding parameters for the current tool.
- RESULT: Displays the execution result of the tool.
- AGENT OUTPUT: The response to the user prompt.
Agent Visualizer reads the sl_agent_log field from the Agent Snap output document to populate the log. For pipelines running older Agent Snap versions, Agent Visualizer falls back to reading from the messages array.
Explore the Interface
The interactive relationship between the Diagram and Log interface facilitates understanding and debugging the interaction between the prompt and the Agent response.
- Click the box containing the agent name (which is the Agent pipeline name) to navigate to the user prompt.
- Click the box of each step in the Diagram panel to navigate to the associated part on the Detailed Log panel.
- Click Agent Output takes you the final response from the LLM.
- Click the chevron on the right side of any box to collapse or expand its content.
Summary of Agent Visualizer UI operations
- Magnification: you can either drag the slider or click on the + and - buttons on each side of the slider to zoom in or out of the Diagram.
- Header: The header displays the
Snap name | pipeline name(such as,Agent Visualizer | E-Commerce DB Agent). - Hover highlight: In the Diagram panel, when you hover the mouse over any label. Both the box and the associated label are highlighted.
- Click-to-select: In the Diagram panel, when you click on any label or box, both the box and the associated label are highlighted. In addition, the Detailed Log panel automatically scrolls to the corresponding Log position, and the related text and boxes are highlighted.
- The X icon: Click to close the interface.
- The Done button: Click to close the interface.
- Collapsible boxes: Click the chevron on the right side of any box in the Diagram or Detailed Log panel to collapse or expand it.
- The Refresh icon: Click to navigate to the top of the Diagram.
- The
 icon: Click to download the Agent Visualizer log in Markdown format.
 - The
 pagination controls: Click the forward or back arrows at the bottom of the Visualization to view responses for multiple requests.
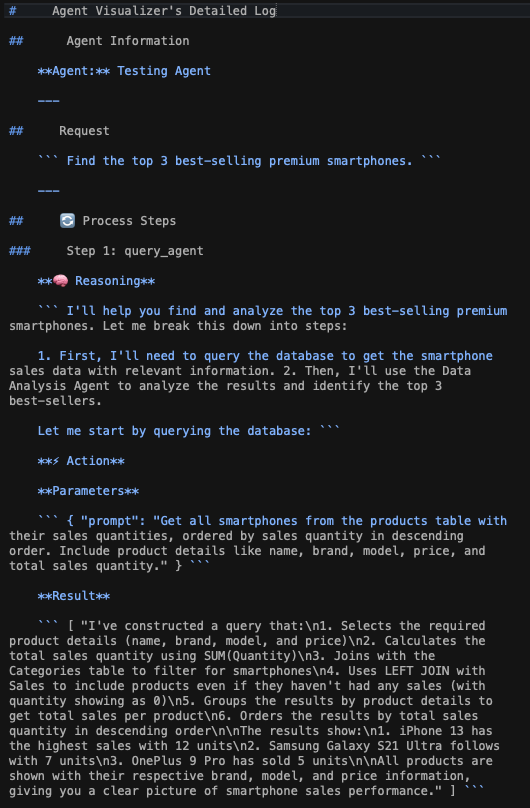
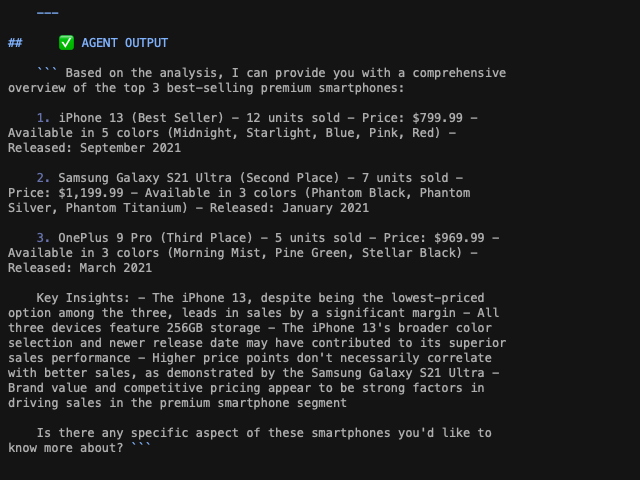
The following images show portions of the Markdown file of the Agent.