Data Preview Controls
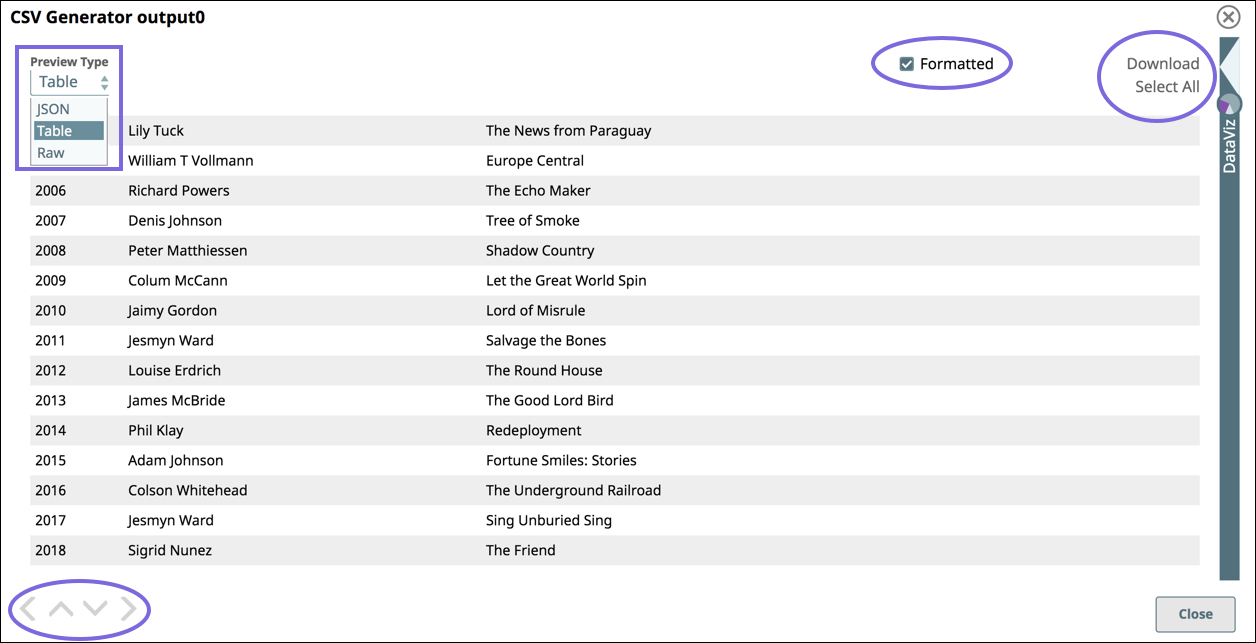
Table Preview
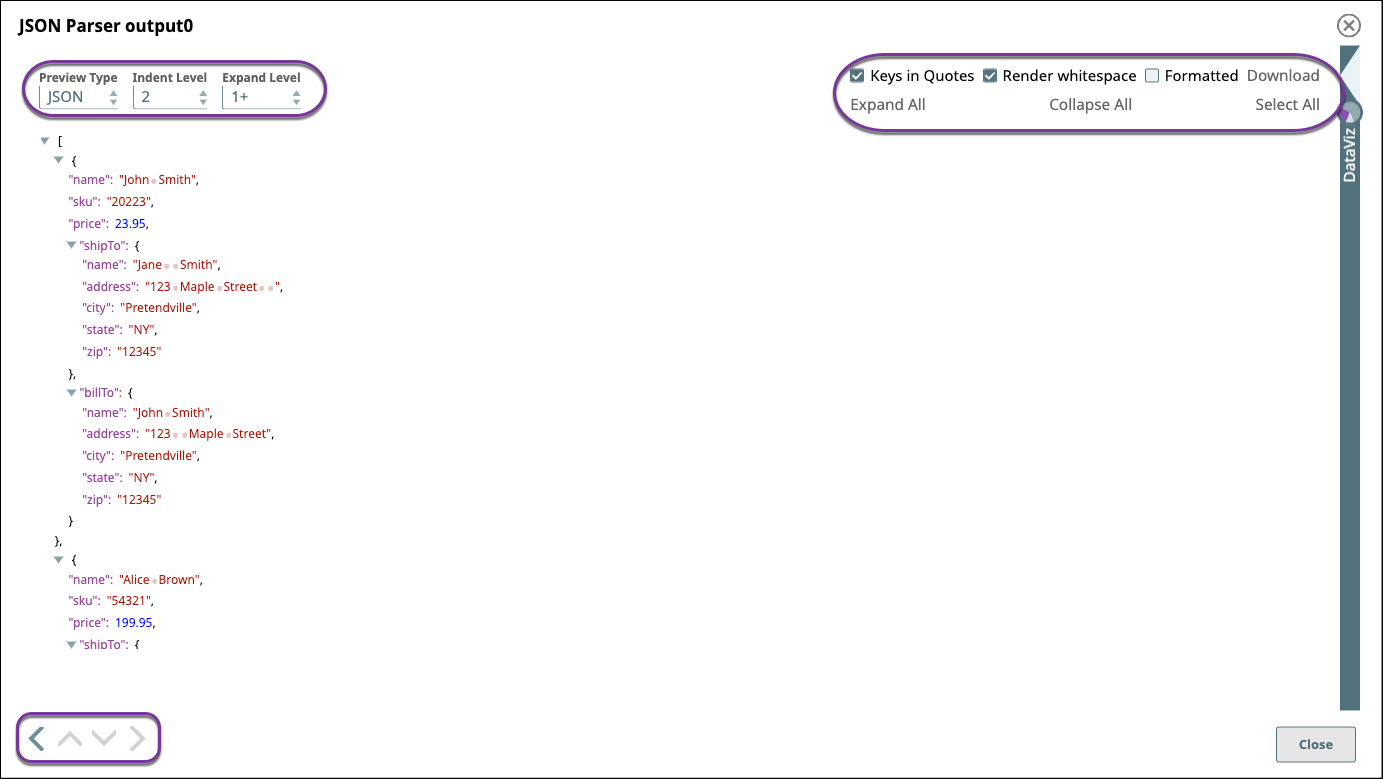
If you change to JSON as the preview type, additional controls are available. Use the controls as follows:
For a description of the controls highlighted in the screenshots, refer to the following table:
| Field | Description |
|---|---|
| Preview Type | Changes the view type of the data:
|
| Navigation |
|
| Formatted | Adds line feeds that improve the readability of
data in table or JSON format. For example, when viewing error documents that have a stack trace column in JSON mode, select Formatted to make troubleshooting easier. |
| Download | Select All and Download to download the entire data set as a JSON file. |
| JSON View | |
| Indent Level | Selects the number of spaces to display indenting the hierarchical JSON elements. |
| Indent Level | Select the number of spaces to display indenting the hierarchical JSON elements. |
| Expand Level | Select the level of JSON elements to display. |
| Keys in Quotes | Select to add quotes in the display to key elements. |
| Render text with whitespace | Renders blank spaces as dots "." and tabs as underscores "_" in the preview data. |
| Expand All | Expands all levels of a hierarchical JSON file. |
| Collapse All | Collapses all levels of a hierarchical JSON file. |
| Select All | Selects the JSON text for copying and pasting. |
| Raw View | |
Data visualization examples
Bar chart with a group count showing distributions of type against characteristic.
Line chart with Date as X-axis showing yearly trend on x-axis with three keys from the data to visualize.