View pipeline details
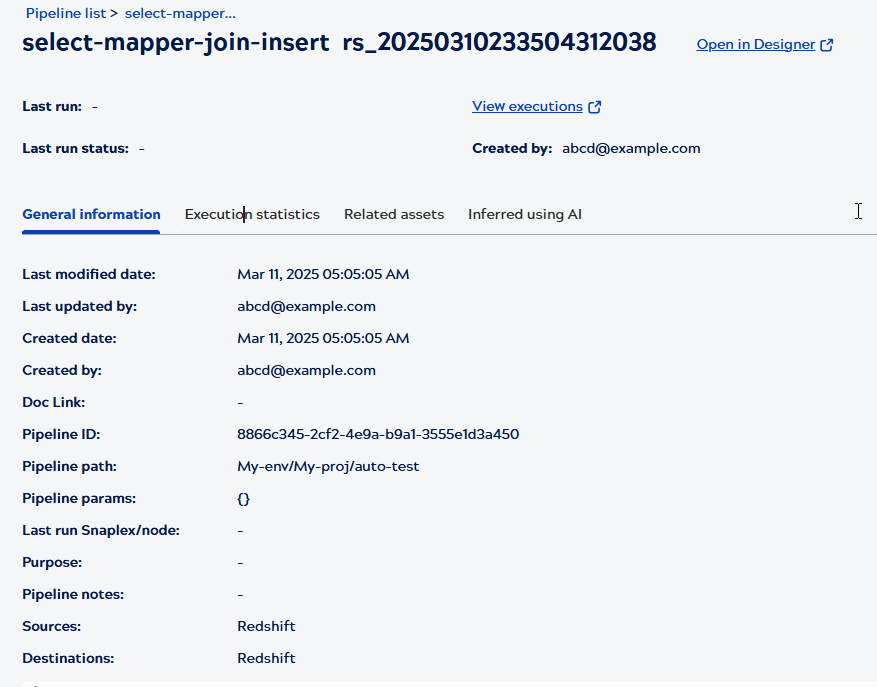
From the Asset catalog Pipelines tab, click a pipeline to open the details panel. The panel header includes:
- A link to open the pipeline in Designer.
- Pipeline metadata, execution statistics, and related assets.
- A link to open the execution history in the Monitor Execution overview page.
- Breadcrumb trail: When you navigate to a related asset, the breadcrumbs tracks the navigation
trail. For example, the breadcrumbs, Pipeline list>{pipeline name}>{ child pipeline name}>{account
name}, reflect selection of a pipeline, a child pipeline, and an associated account.Note:
- Asset names in the breadcrumb show only the first 16 characters.
- The breadcrumb shows only the six most recently clicked assets.
- Clicking any asset in the breadcrumb removes all the trailing breadcrumb links.
General information tab
The General information tab for pipeline details includes values from the table columns.
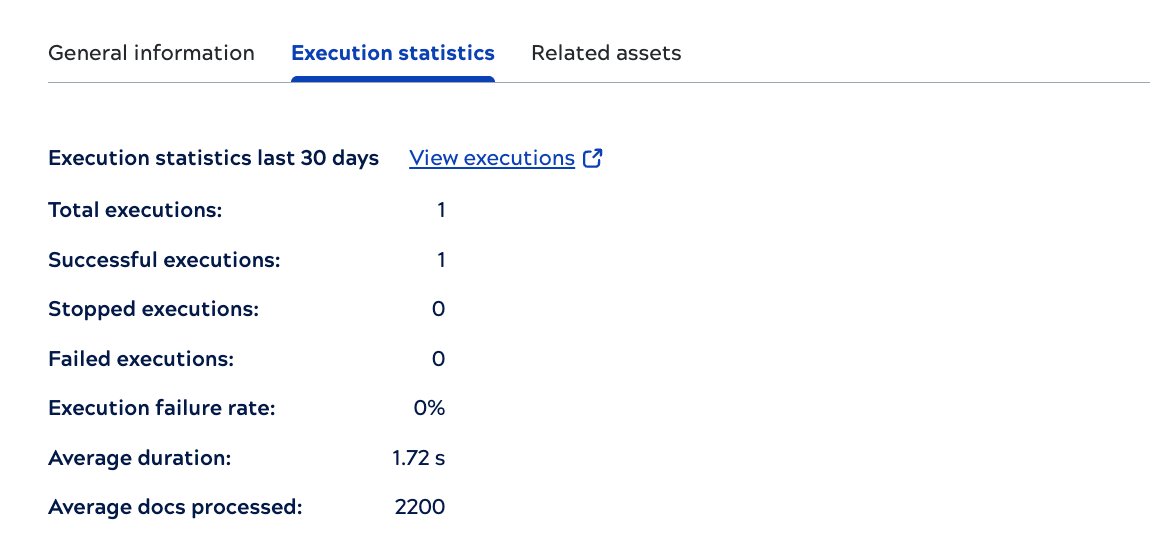
Execution statistics tab
The Execution statistics tab shows data for the last thirty days.
Related assets tab
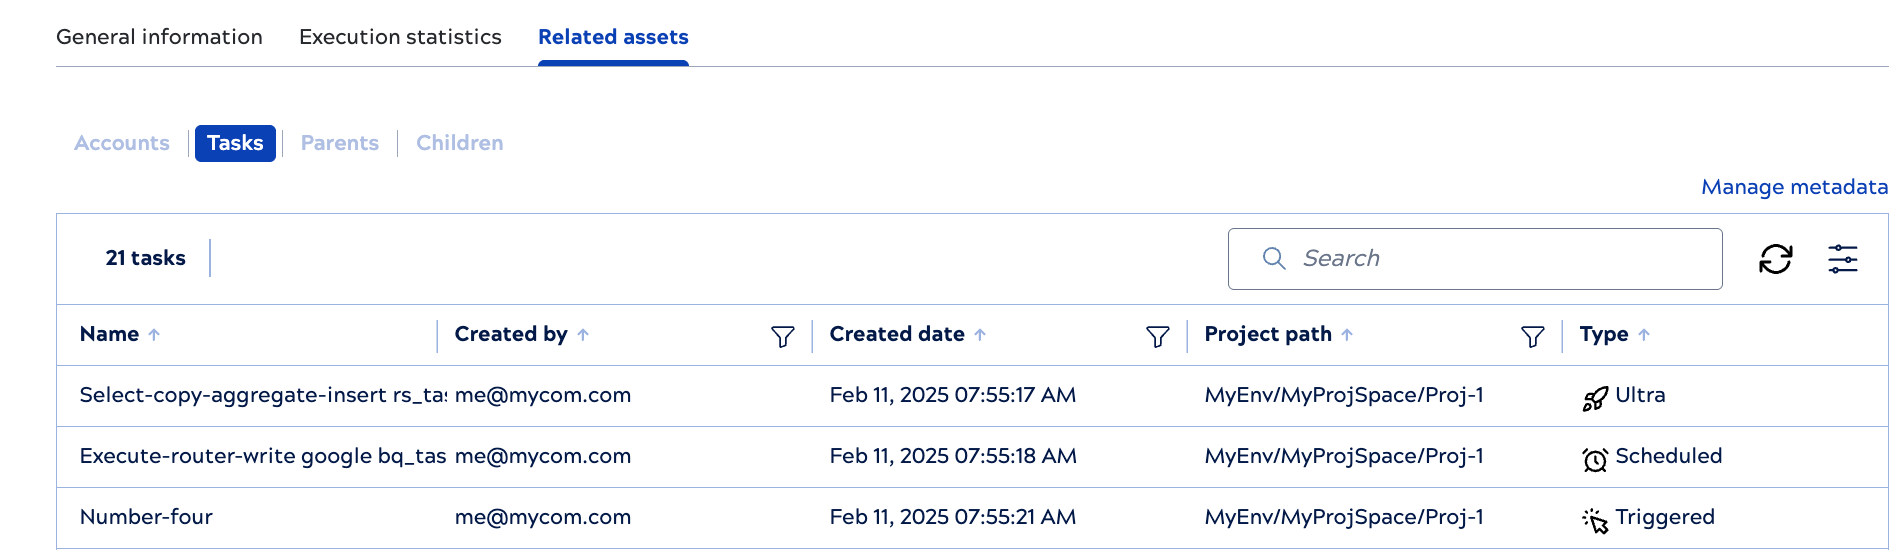
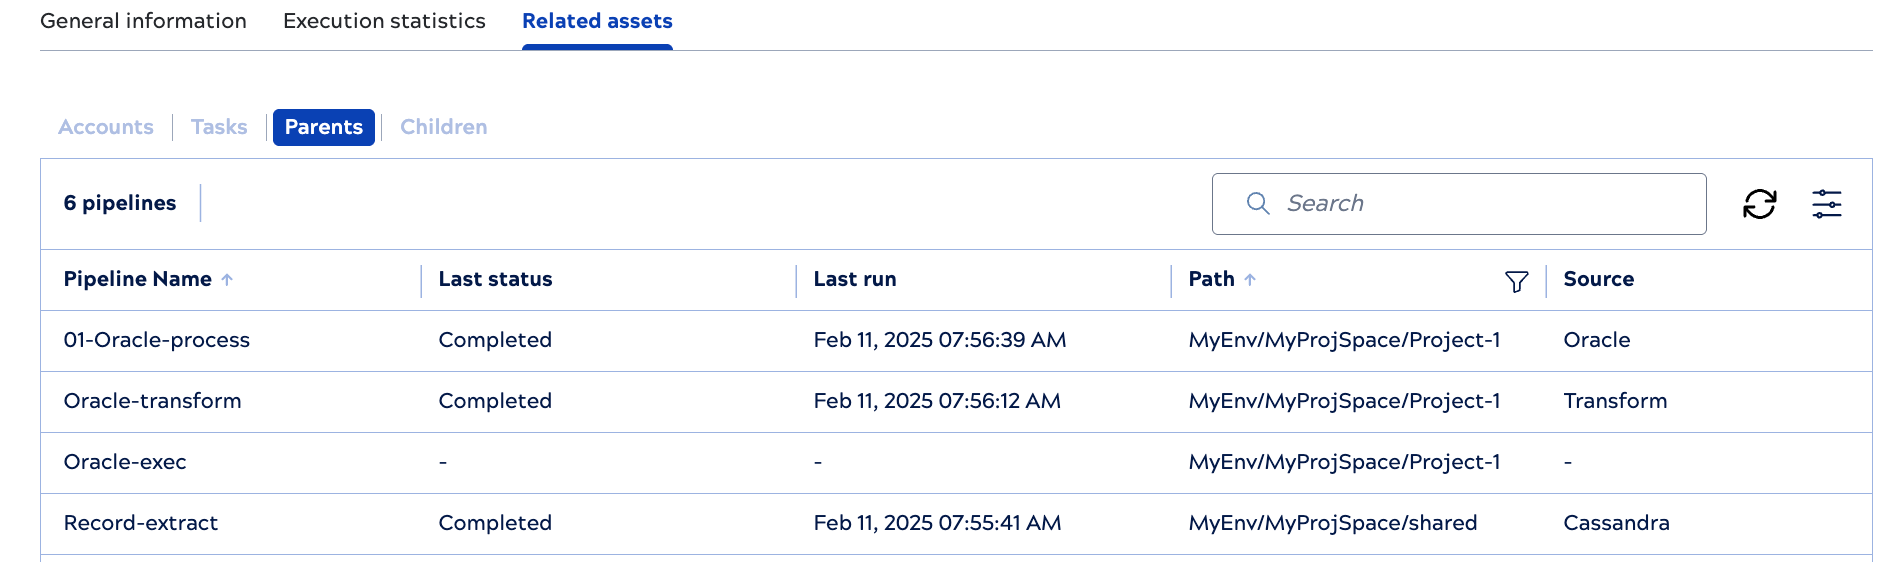
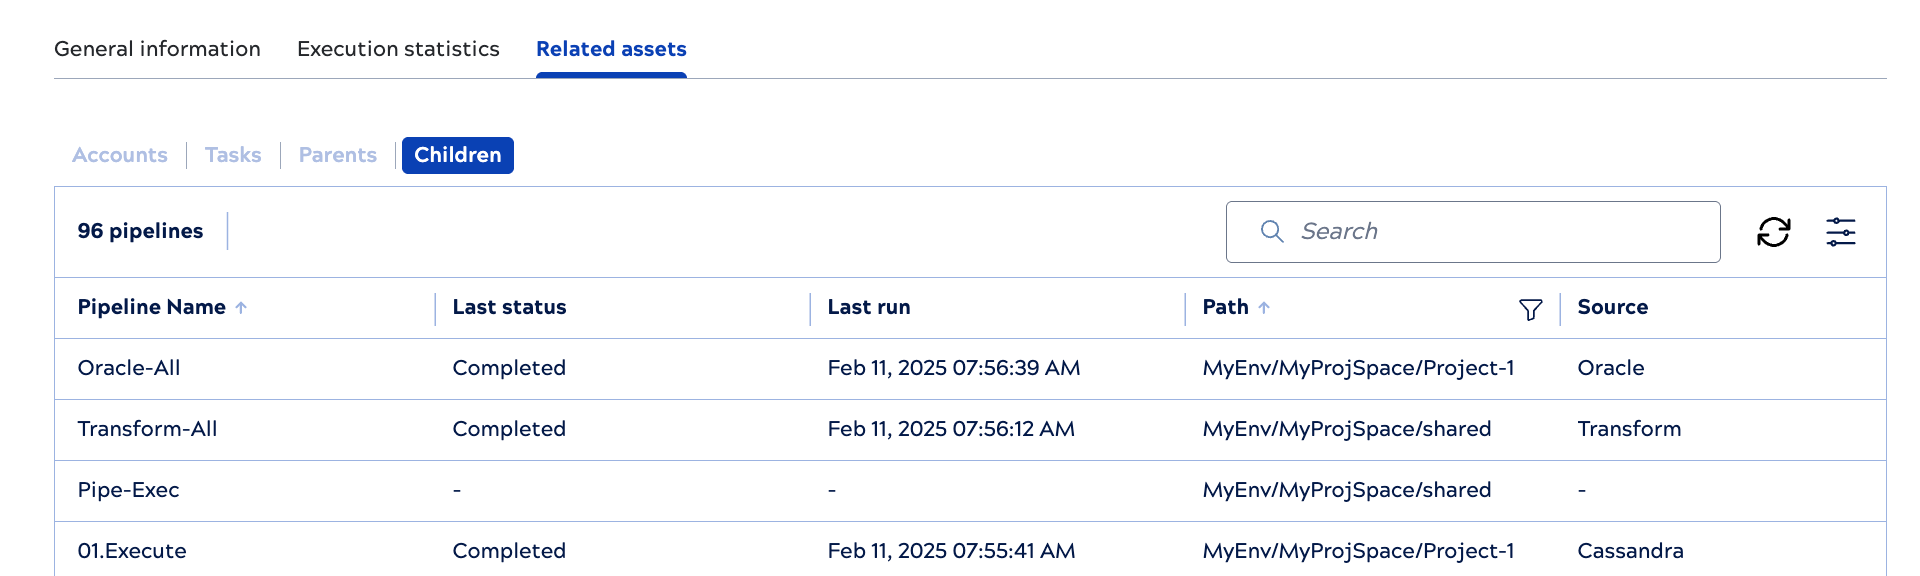
From the Related assets tab, view all accounts, tasks, and pipelines associated with the selected pipeline. Search and filter columns to find the asset of interest.
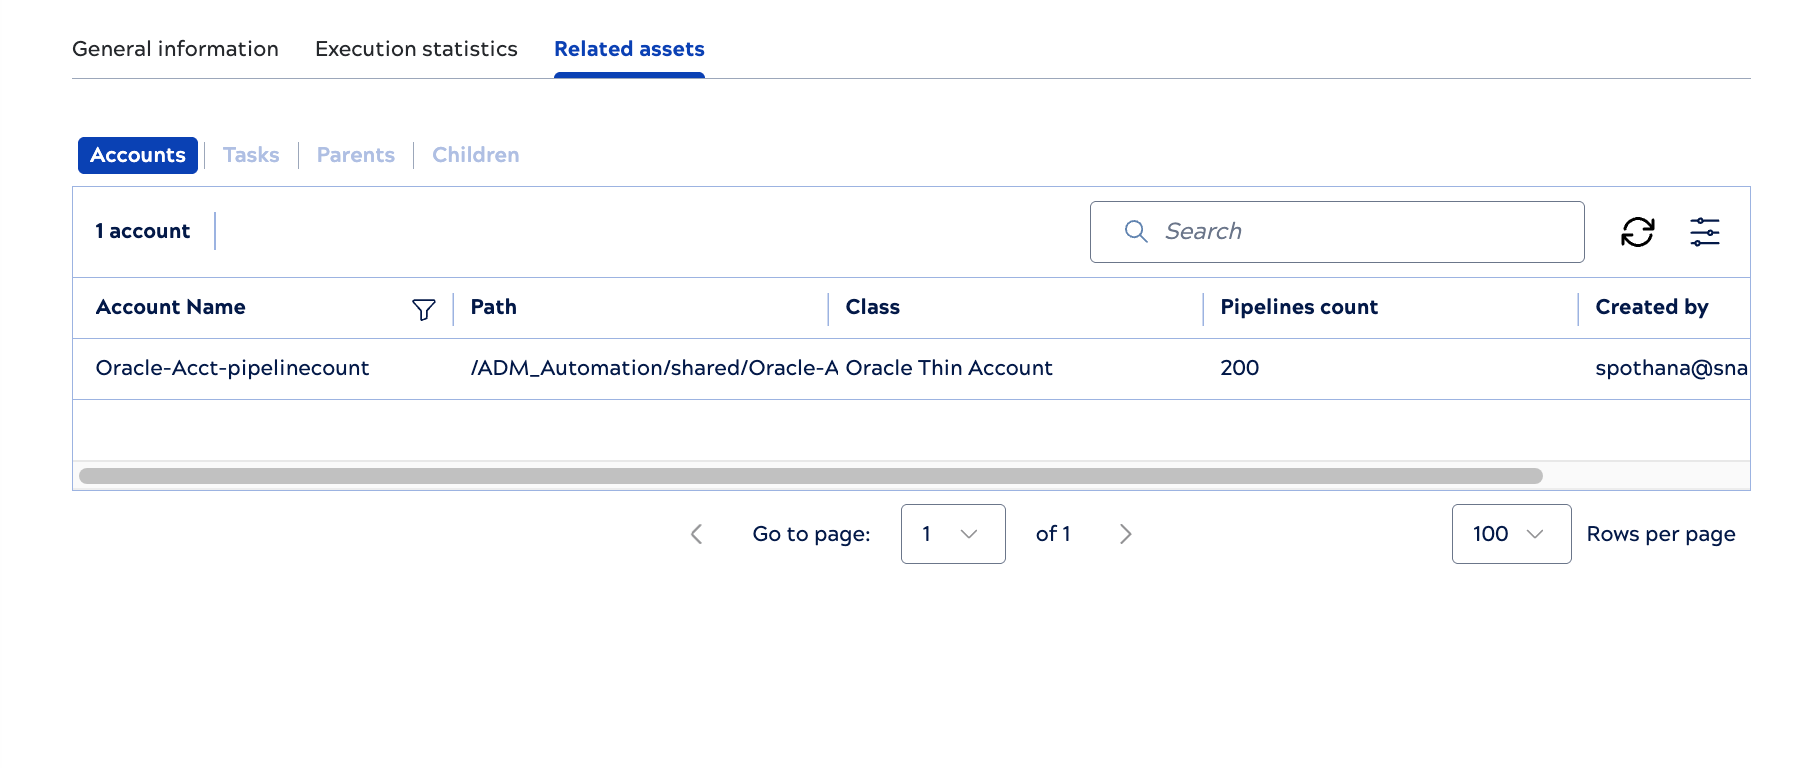
The following screenshots show examples of the Tasks, Parents, and Children tables: