


Studio (preview)
SnapLogic Studio provides a modern easy-to-use interface. We are releasing functionality incrementally.
New Features
The Infrastructure System overview page provides monitoring capabilities to help you visualize and troubleshoot the behavior of Snaplexes and their nodes. Org admins can also start and restart nodes and a Snaplex from this page.
To open the System overview, from the left navigation pane in Studio, click . The System overview opens in the Node Map View and displays the Snaplex instances and nodes in your Org.
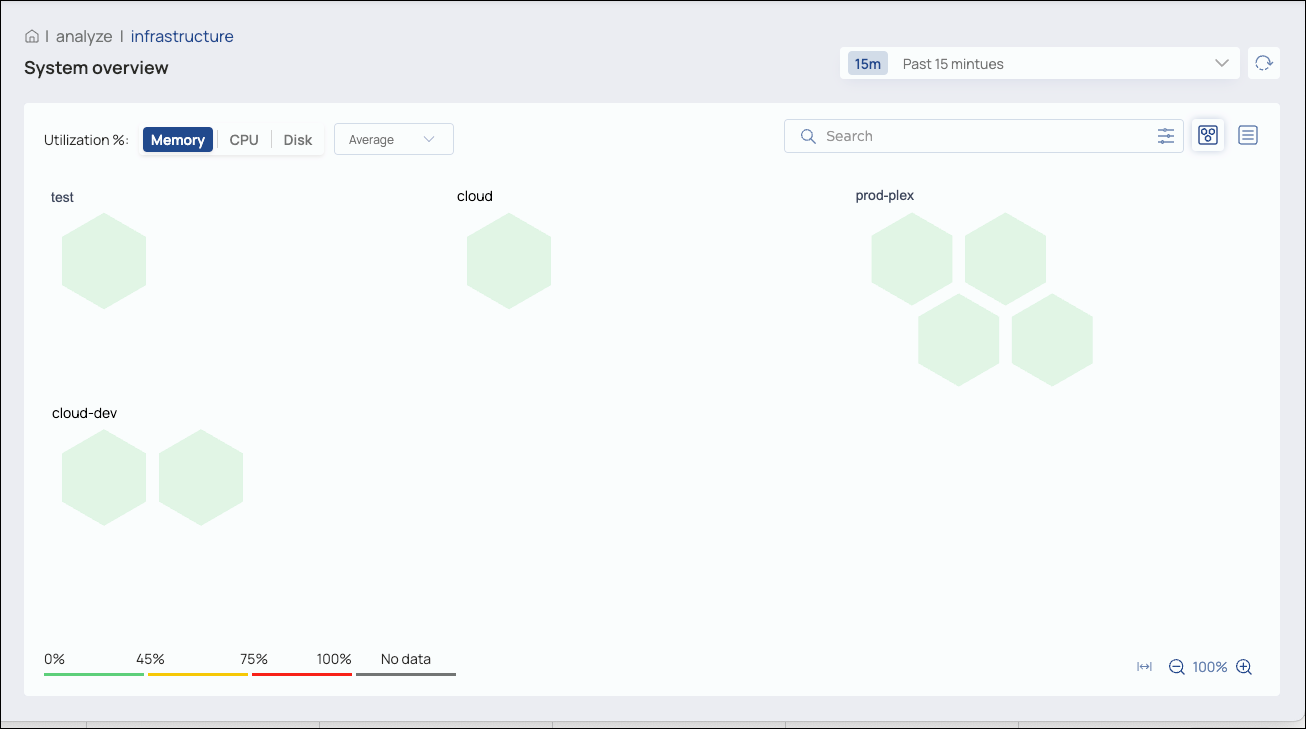
The initial view shows the Snaplex Node Map with the average percentage of memory utilization for the last 15 minutes. Refer to the legend on the bottom left of the screen for the node color key. Roll your cursor over a node to view the average percentage value.
- Change the time period
- Refresh the view manually
- Search for a Snaplex or node and add Advanced search filtering on type, node status, Snaplex version, and operating system
- Switch between map and list views
- Switch between viewing memory, CPU, and disk usage
- Switch between average and maximum usage
- Select a node to view its details
- For customer-managed nodes, Org admins can restart a node, put it in maintenance mode, or exit maintenance mode
- Switch between viewing Snaplexes and nodes
- From the Node list, start or restart a node or put it in maintenance mode
- From the Snaplex list for customer-managed nodes, Org admins can start or restart all nodes
- Resize the columns
- Sort by a column
For information on the best ways to use the System overview, refer to PREVIEW | Analyze: Infrastructure.