


Monitor and manage the infrastructure
The following sections describe how to:
View Snaplex details
From the Infrastructure System overview node graph or list view, click a Snaplex to open the details panel. Snaplex details include information on the Snaplex and its nodes:
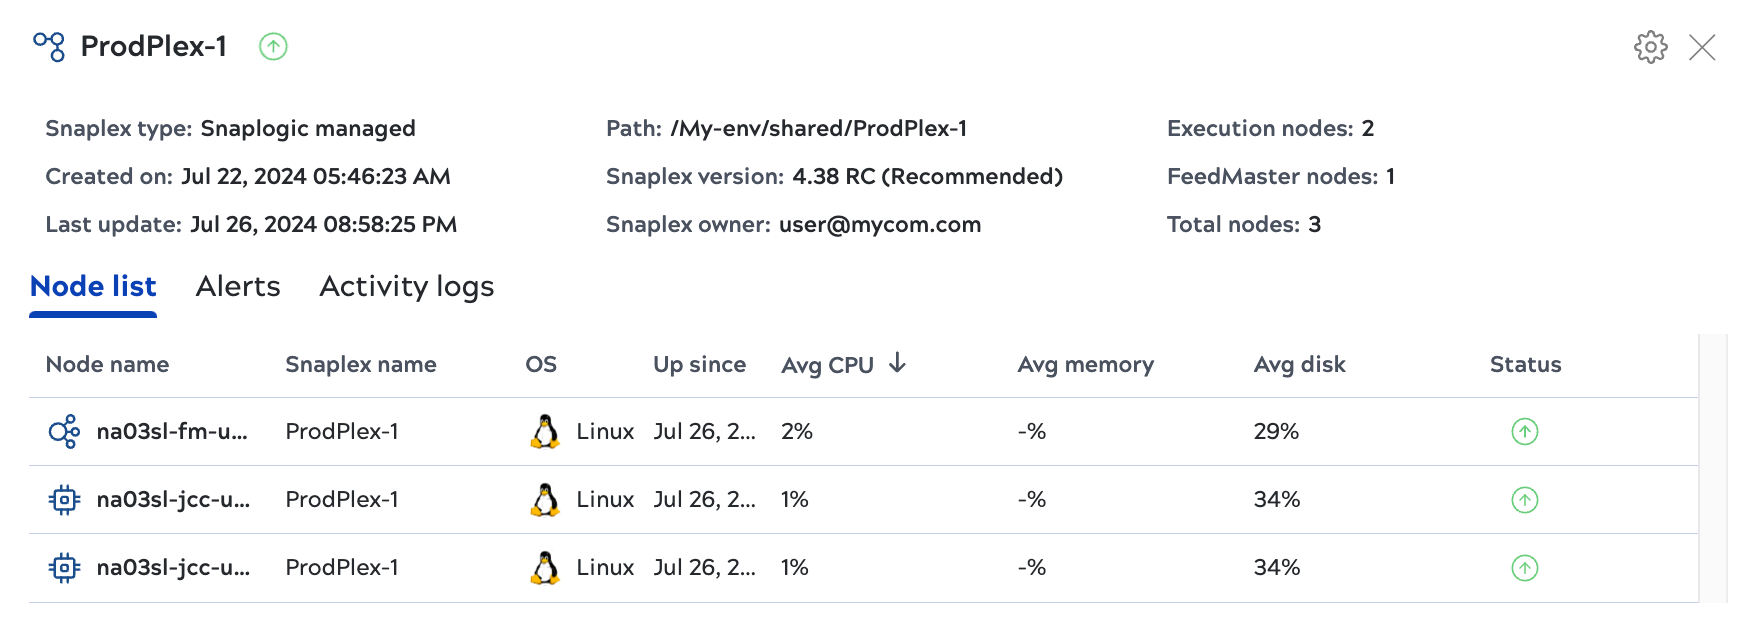
In the details panel:
- Click a node to view its details.
- The Alerts tab shows node alerts such as failures to communicate with other nodes.
- The Activity logs tab reports Snaplex activities, such as when a node is added or removed.
- For self-managed Snaplexes, Org admins can click the gear icon to start or restart Snaplex nodes.
Restart nodes
Org admins can restart self-managed Groundplex nodes from the System overview page.
To restart all Snaplex nodes:
- In the Search toolbar, click List view.
- Click Snaplex list.
- Click the Snaplex to restart. The details panel opens.
- Click the gear icon.
- Click Restart Snaplex.
To restart a single node:
- In the Search toolbar, click List view.
- Click Node list.
- Click the node.
- To the right of the Status column, click the gear icon.
- Click Restart node.
View mean execution time for Ultra Tasks
FeedMaster node details include the mean execution time for the last 1000 requests handled by active Ultra Tasks. To view the execution time from Monitor, follow these steps:
- From the Monitor navigation pane, select Infrastructure.
- Click Node list.
- Click the node on which the task is executing. The node details on the In progress requests tab include an Execution time column.
View offline nodes
Nodes in a Snaplex send a heartbeat every 20 seconds to the control plane to indicate they're active. Nodes that don't send a heartbeat for five minutes change color, which indicates no data has come from them. Nodes without a heartbeat disappear from the System overview after 15 minutes. Change the time period to view nodes that went offline. Offline nodes remain in the System overview for one week.