Studio (preview)
Key New Features
- Introduced runtime details for the Execution overview when you click on a Task or Pipeline execution.
- Added support for search in the table of executions on the Execution overview.
- Introduced new icons for Pipeline execution status that show executions with errors and those that were completed with warnings.
New Features
-
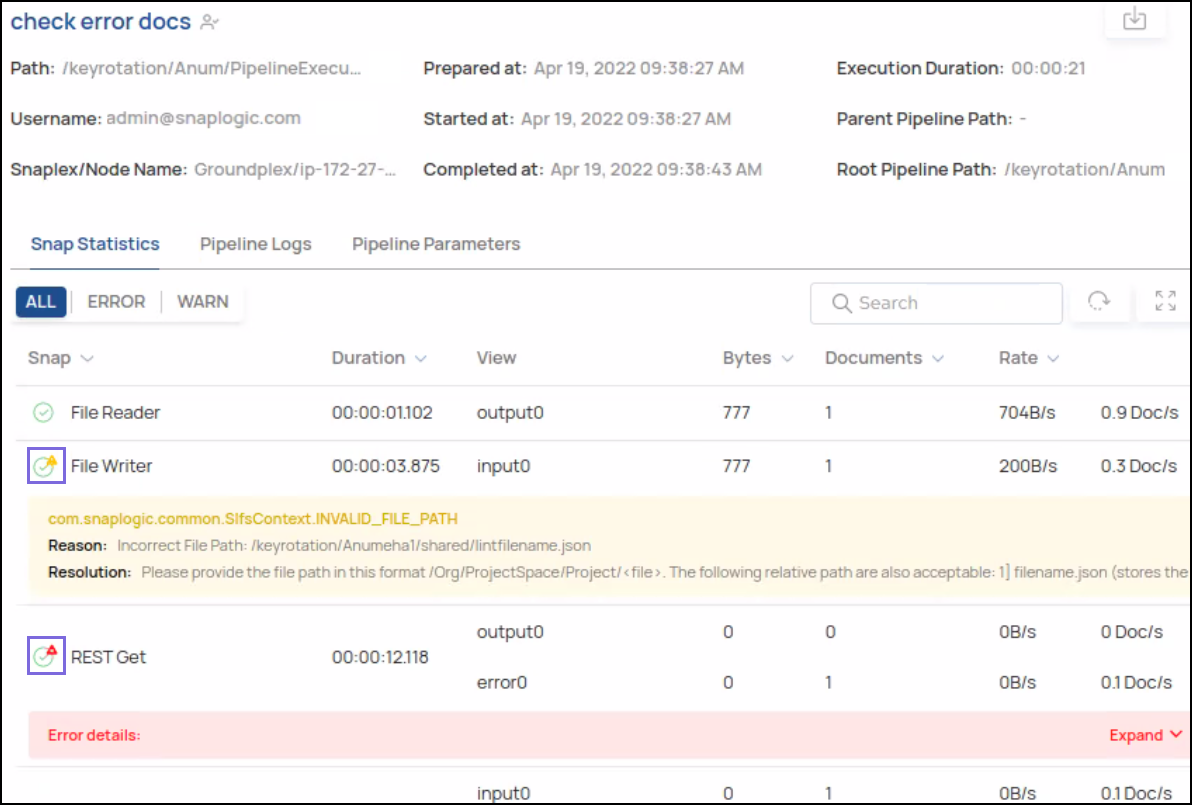
Execution Overview Includes Pipeline and Task Execution Details
You can now view details
and execution statistics for your Pipelines and Tasks.
When you click on a Pipeline or Task, SnapLogic Studio displays a fly-out panel with information about the invocation type, the name of the Snaplex, execution times and duration, as well as information about Snap statistics, Pipeline logs, and Pipeline parameters.
The Pipeline and Task execution details enable you to survey Pipeline and Task executions in your Org and then drill deeper to understand individual Pipeline execution details.
-
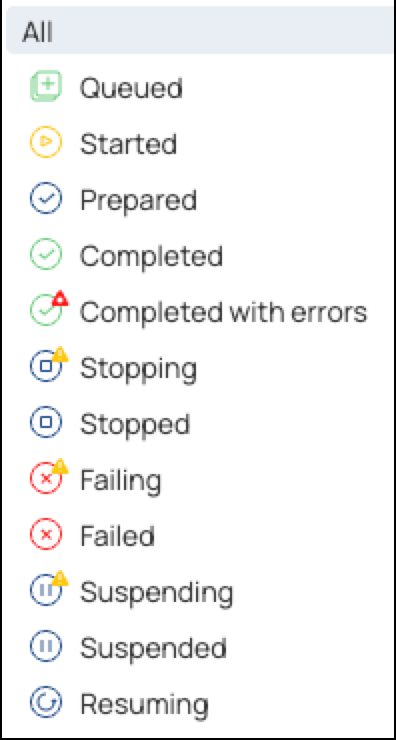
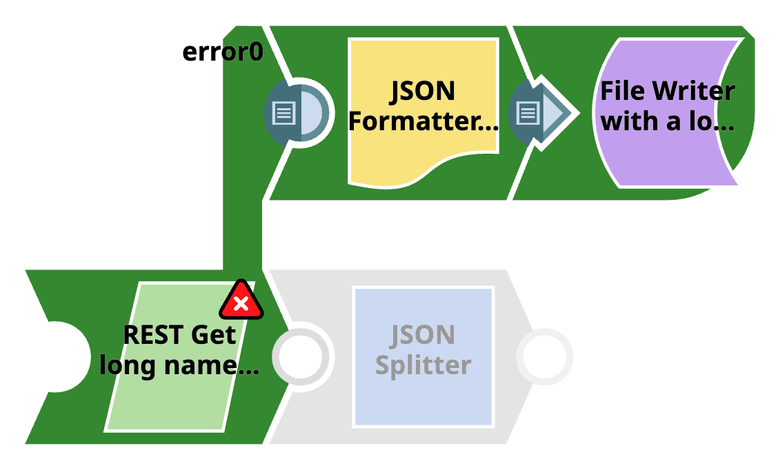
New Execution Status Icons
New icons indicate Completed with Errors and Completed with Warnings statuses of your Pipeline executions when you select Route Error Data to Error View in the
setting in a Snap.
Likewise, when Snaps encounter warnings or errors, the Snap displays an icon for each state respectively to indicate the status after Pipeline execution.

-
Search by Execution Status
You can now filter results by several attributes, including Pipeline execution status (for example, Started) and the person who ran the execution.
You can also add and remove columns and rearrange them.
This functionality enables you to quickly find Pipelines in specific states, as shown in the following screenshot: